The projects here document analytics and business intelligence work, focusing on the problem being addressed, the structure of the data, and the decisions the analysis was built to support. The emphasis is not on visual output alone, but on how information is modeled, standardized, and delivered in a way that remains consistent as requirements change.

Cyclistic Bike-Share Usage Analysis
An exploratory analysis of Cyclistic bike-share data comparing casual riders and annual members. Ride behavior was examined across monthly, hourly, and day-of-week patterns to identify key differences in usage. The analysis revealed a strong weekend-focused trend among casual riders versus consistent weekday usage by members, leading to a data-driven recommendation for a weekend-based membership tier.
View full case study →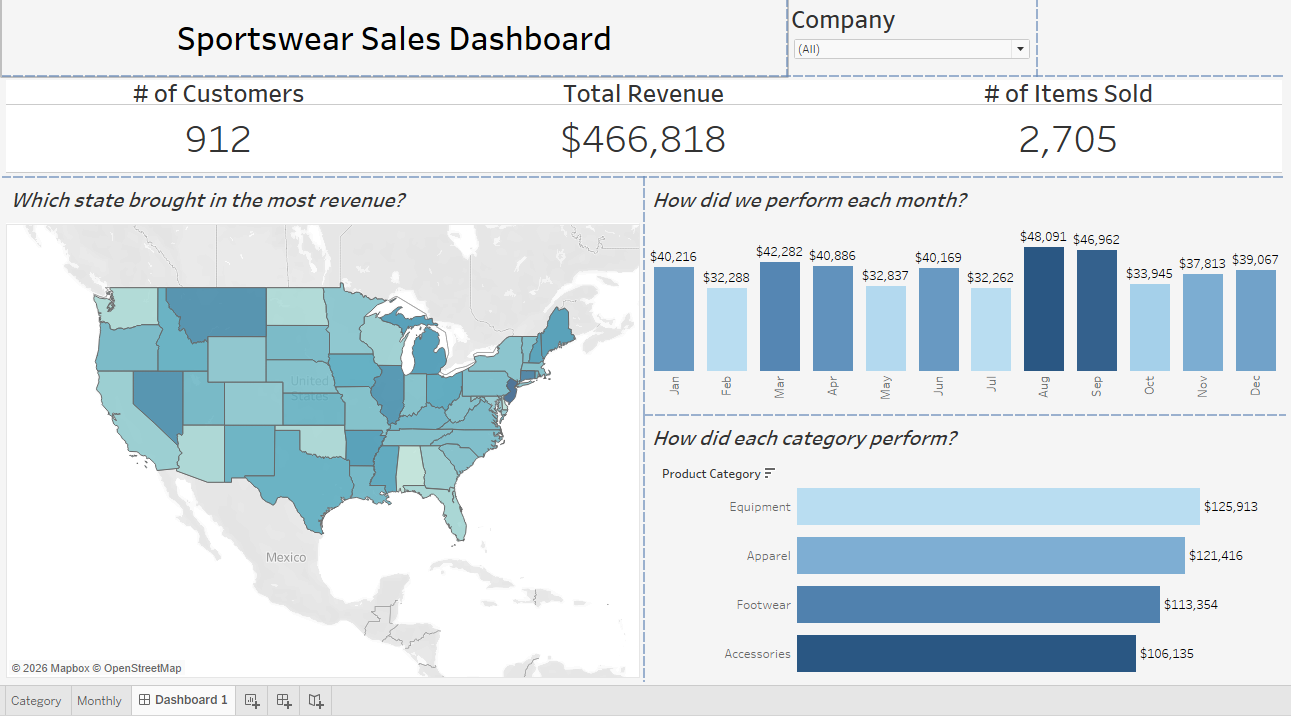
Sportswear Sales Dashboard (2023)
An interactive overview of 2023 sportswear sales featuring Adidas, Nike, Under Armour, and Puma. The dashboard highlights total revenue, customer volume, and units sold, with visual analysis across geographic regions, monthly trends, and product categories to surface revenue drivers and seasonal patterns.
View interactive dashboard on Tableau Public →
Titanic Survival Analysis
An exploratory data analysis of the Titanic passenger dataset examining survival outcomes across class, age, gender, and fare price. The project focuses on identifying key factors that influenced survival probability while applying data cleaning, feature exploration, and visual analysis techniques to uncover meaningful patterns in historical data.
View full case study →